House Zero Holo
AR Building Performance Visualization Tool Developed For Harvard CGBC
Work at Harvard CGBC | 2018 Teammates: Mia Guo, Brian Ho, Jiho Song Skills: Hololens AR Developement Tools: Unity, HoloToolkit, Rhino
House Zero
House Zero, the headquarter of Center for Green Buildings and Cities (CGBC) at Harvard, claims to be the world’s most sustainable house.
Our project is part of this ongoing research at House Zero on smart/responsive buildings & simulated environments.
Using AR, we created an immersive and intuitive interface for researchers & others to visualize and interact with building-related data.
Project Goals
help visitors understand the building's innovations (natural ventilation, day-lighting and net-zero energy consumption),
allow building managers to monitor the running conditions of building infrastructure,
assist CGBC researchers in relating the data with the environment to validate their research and generate new research initiatives.
Features
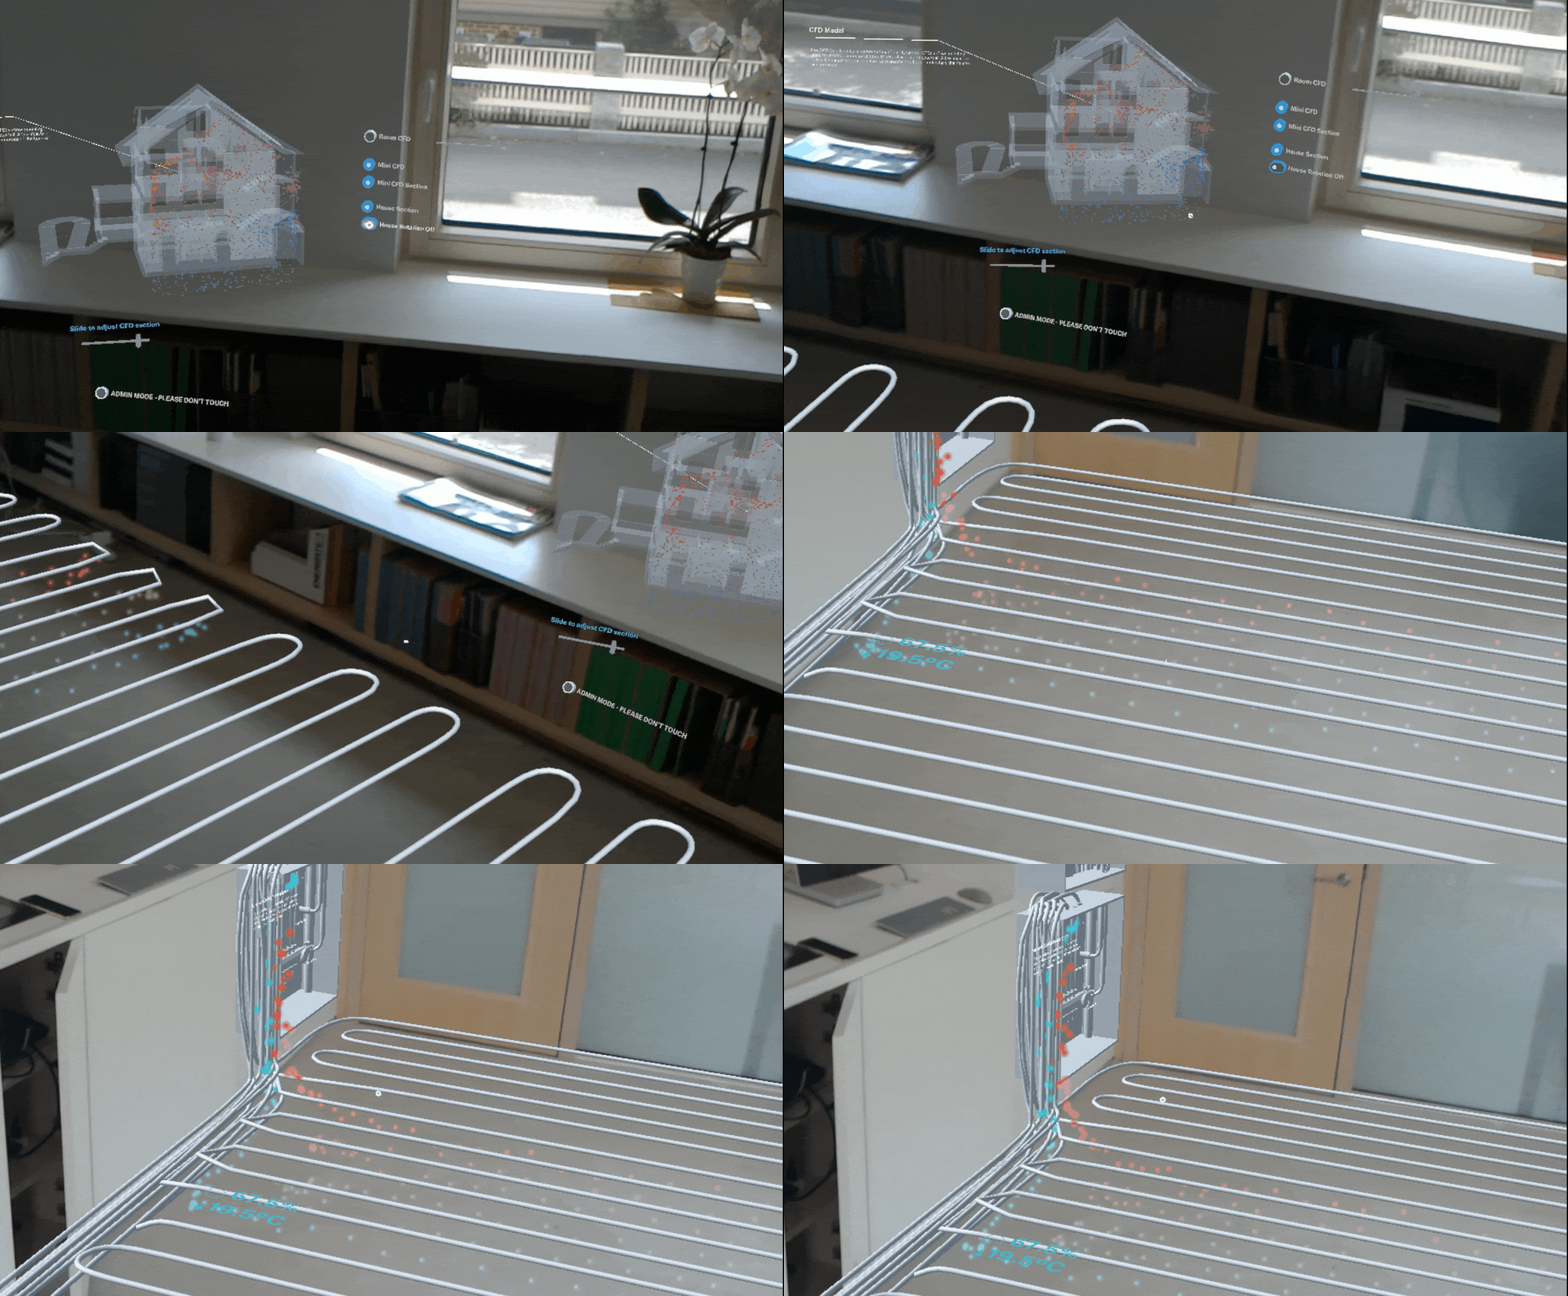
The miniature-scale view includes: a model of HouseZero associated with CFD visualization and a control panel UI.
Viewers can interact with the miniature-scale house model to grasp the big picture of how this building is functioning.
The room-scale view includes the sensor values——temperature and humidity,
a operable window and associated airflow for user to control with gesture,
an interactive section of room-scale CFD data (computer fluid dynamics simulation)
and a behind-the-wall visualization of building infrastructure.
Why AR?
Seeing information superimposed on the actual building space will enable viewers to identify patterns,
to raise valuable insights, and to make associations between the data and the environment, or even notice ergonomic details
when they are using their body to feel the scale.
Information Flow
The AR interface serves as the front-end to a set of servers and databases revolving around HouseZero.
It displays real-time CFD (computer fluid dynamics) model simulated to reflect current air-flows,
as well as building sensors and infrastructure data.
Data is being displayed on top of the building interior mapped to the exact places, providing intuitive understanding of the building.
My Role
I was responsible for 1) debugging the previous versions, make it compatible with new versions of Unity and Hololens,
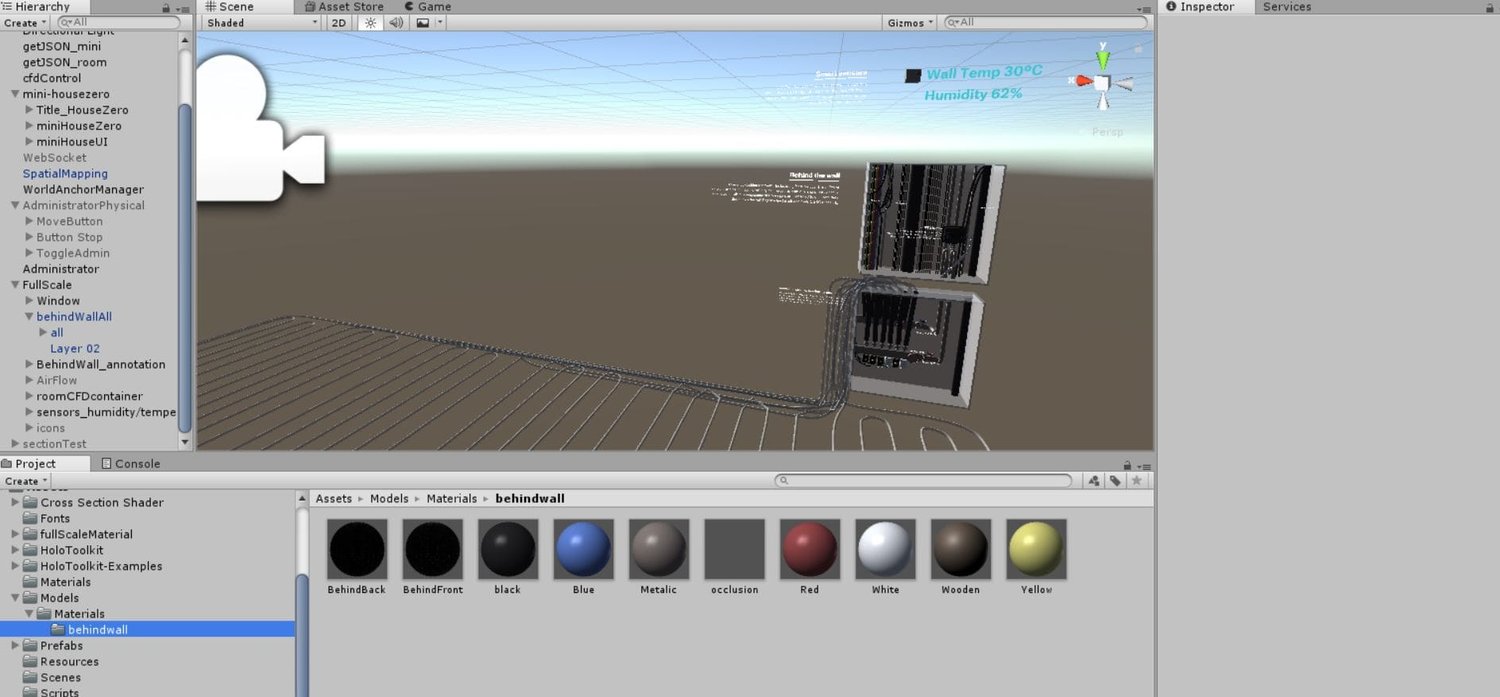
2) make visualization for behind-the-wall infrastructure (3D modeling, mapping as well as flowing particle animations in Unity),
3) improve the whole AR viewing experience by user-testing & optimizing UI.
Making Models In RHINO
Unity Development
Unity Development
Animating Cooling Flow
Field Test
This app has been tried out by myriad visiting guests and researchers including the previous President of Harvard University.
What I learned
“When we design AR experiences, ease of use and prior user education is key.
Experience doesn’t start from the moment users put on Hololens under our guidance,
it starts from the moment they step into the house,
or even, when they first learned about the project.”
Future Work
1. User Journey Design: design from the moment that the AR experience truly starts till it truly ends.
2. Evaluation: design experiments to evaluate the effects of AR on researchers and visitors in understanding data on a better level.
3. Device: try out other AR devices that are more economic, or offer a wider FOV.
4. Design For The Brain: our brain is extremely good at remembering 3D data. How we can tap into this function of our brain
to change the way we interact with the data in AR, to increase our learning ability or productivity?
5. More Interaction: for different user scenarios, design more engaging and meaningful user interactions.


